Chocs and Blocks
Notes for teachers
Chocs and Blocks is an in-class sampling activity designed to provide an experiential foundation upon which students can build understandings of sampling and sampling bias, sampling variability and estimation, sampling distributions and other key statistical concepts. These notes are intended for teachers (including lecturers, tutors or secondary school teachers) to help you get started with the Chocs and Blocks activity.
Requirements
To run the Chocs and Blocks activity, you will need:
- One or more trays of chocolate pieces, about 100 pieces per tray;
- One or more teachers or assistants to facilitate the activity;
It is ideal to have someone leading the discussion and focusing the activity and a second person managing the technology. For large cohorts, such as in a lecture theatre, having additional tutors for the ‘finding a sampling strategy’ part of the activity helps to keep the conversation focused.
- A classroom with internet access for students (either fixed PCs as in a computer lab or Wifi access so students can use their laptops/tablets/etc);
- One or more computer projectors to display web pages to the class.
For a small class, eg. 30 or less, you can get by without a projector. See comments under ‘Technical setup’ below.
Overview of the activity
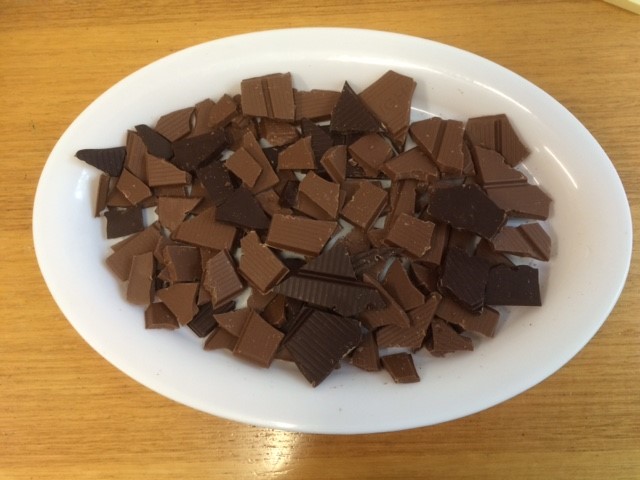
Students are presented with a tray of 100 chocolate pieces. The pieces are irregularly shaped and vary in size. The task for students is to come up with an estimate of the average weight of a piece of chocolate on the tray. The most accurate estimate will be rewarded with first pick of a piece of chocolate from the tray.
- There are 100 pieces of chocolate on the tray (they are told this at the start);
- The weight of each individual piece of chocolate is known, and students can find out the weights of individual pieces in the next stage of the activity;
- Each student can find out the weight of 10 pieces on the tray, but they must specify which 10 pieces.
Choice of sample size and whether or not everyone should use the same sample size could be a discussion point at this stage. But note that if all students use the same sample size then the data easily lends itself to exploration of the Central Limit Theorem later on.
Once students have discovered that they will be given the chance to find out weights of specific pieces, their task is to come up with a strategy for which pieces to choose. When most of the class has reached this stage, the teacher directs students to open the Chocs and Blocks website on their computer, tablet or phone. The teacher tells them:
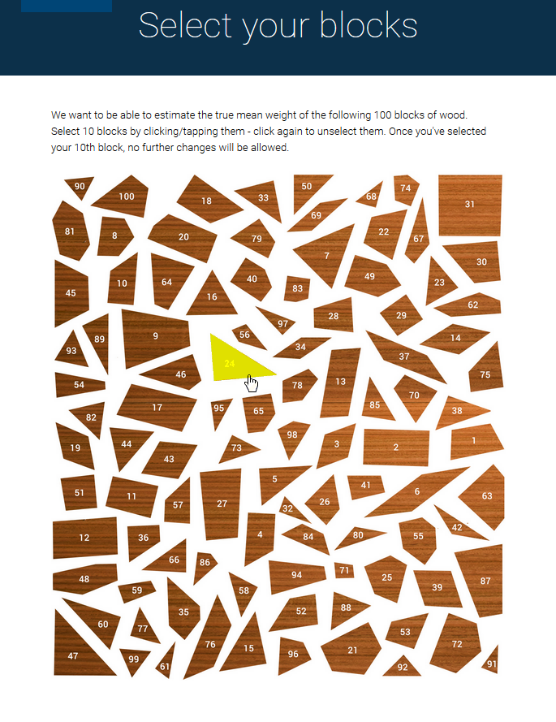
“The blocks on screen are a virtual representation of the pieces of chocolate. Your task now is to select 10 pieces, whose weights you will be given.”
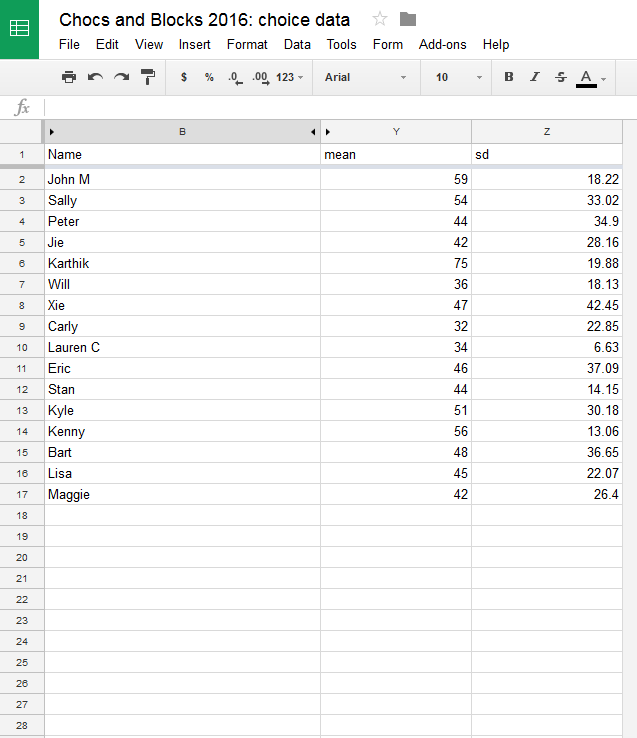
Students select their 10 blocks using the website, and the website calculates the individual weights and mean weight of the blocks they’ve chosen. They enter their name and hit ‘Submit’ and their data is automatically recorded on a spreadsheet. (They are only allowed to do this once each.) The spreadsheet can be displayed on a projector so that students can see their data arriving.

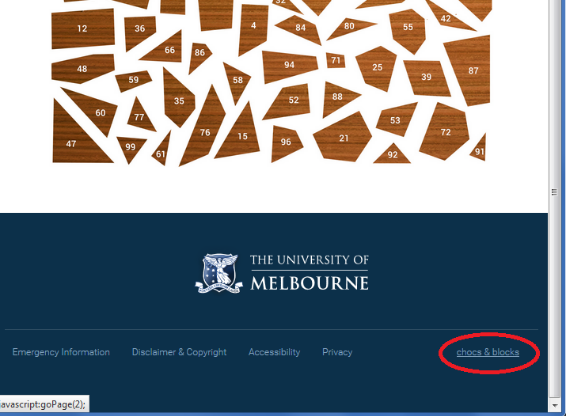
The next step is to direct students to click on a hidden link on the Chocs and Blocks page (the link labelled ‘chocs & blocks’ at the bottom-right of the page - see Figure 4 below), which takes them to ‘random sample’ mode. In this mode, the computer will take a random sample of 10 blocks. Students again record their sample statistics and name to a spreadsheet, displayed on a projector.
Pedagogical considerations
It can take students a long time to discover that they can ask the weights of individual pieces. Some hints might be needed periodically to help them reach this point.
Common strategies for choosing blocks include “choose 5 large and 5 small”, “take every 10th block, ie blocks 1, 11, 21, 31,…”, “take all blocks on the bottom row”. These can lead to some discussion: Is the distribution of block weights/sizes symmetric? (No!) Is there any correlation between block numbers and sizes? (Yes! Larger blocks tend to have lower numbers.) How might these affect the resulting estimates?
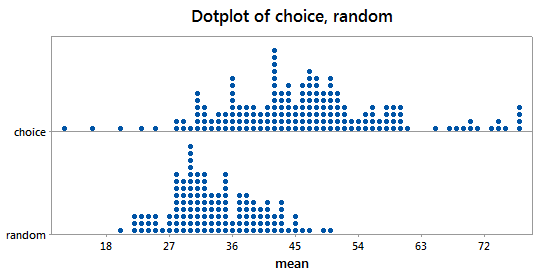
The true mean of the block weights is 33.5. The choice samples always tend to overestimate this. (This has been true every time the activity has been run for over 15 years.) Students are often surprised to see how far off they, and much of the rest of the class, were in their estimates. This is a powerful motivator for the need to study sampling methods and the value of random sampling.
A spreadsheet of all block numbers and weights can be downloaded here.
Practical considerations
For large classes, you will likely need more than one tray of chocolate and several teaching staff to answer questions and carry around the trays. For a lab class of ∼40 students we use 2 tutors; for a lecture class of ∼200 we have 1 lecturer and 4-5 tutors.
We suggest not using a familiar supermarket brand of chocolate, eg Cadbury, as students might focus on the weight of a whole block which they could easily Google. We use sheets of chocolate from Haigh's, which are easy to break into irregular shapes and hard to Google for. Haigh’s chocolate comes in sheets so it has uniform density. Students are then looking for ‘representativeness of the sample’ based on shape and size of pieces only. This helps to keep things simple.
If you project the results spreadsheet onto a screen, some students are tempted to use funny/rude names to get a laugh when they appear on screen. Be warned.
Technical setup
For small classes (about 30 or less), you could just have students call out their sample means one-by-one and record the data manually on a whiteboard or Excel spreadsheet. Then you don’t need to use the submit-to-spreadsheet functionality. But for large classes, it is valuable to have the spreadsheets set up to automatically record students’ data. We have provided a Chocs and Blocks setup program to help with this. The setup program will create:
- Google spreadsheets for storing the data – one for the choice samples, one for the random samples;
- Google forms – these are used by the Chocs and Blocks website to pass the data into the spreadsheets;
- A web link for your students to access the Chocs and Blocks page, preconfigured to store data in the newly created spreadsheets; and
- Links to the two spreadsheets for you to display on a projector or download the data.
We suggest that you put the Chocs and Blocks web address supplied by the setup program, and the QR code, on a Powerpoint slide and display it to the class when you are ready for them to access the Chocs and Blocks website. You might also write the web address on a whiteboard. Students can type in the address or they can scan the QR code with their devices.
If you have more than one projector available, we suggest displaying the web address on one and the Chocs and Blocks page on another, to allow students who are sharing a device to start choosing their blocks. Once students have loaded the page, you can display the spreadsheet instead of the address, so that students can see the data coming in. If you have only one projector, we suggest writing the web address on a whiteboard and displaying the Chocs and Blocks page initially and later switch to the spreadsheet.
The spreadsheets record the weights and numbers of the individual blocks in the sample, as well as sample mean, standard deviation , students’ names and a timestamp. Most of these columns are hidden by default by the setup program, leaving just ‘Name’ and ‘Sample mean’ displayed for students to see. But you can unhide them if you wish. (They will still be stored in the spreadsheet so will be available for further analysis later if desired.)
If you are running the activity more than once, you can re-use the same spreadsheets and Chocs and Blocks link if you wish. Just clear out the old data from the spreadsheet first, or open the Google forms from your Google Drive and choose a new destination spreadsheet for the data.
Note: The results spreadsheets created by the setup program are set to be ‘Visible to anyone with link’ by default, to make it easy for tutors or students to access the data. If you don't want the data to be publicly visible to anyone with access to the link, then you can change the permissions on the Google Sheets from within your Google Drive.
Suggested running sheet
Here is a suggested running sheet for Chocs and Blocks in a 50-minute class.
|
When |
What’s happening |
What’s shown on projectors |
|
0-2 minutes |
Teacher introduces activity |
Nothing |
|
2-20 minutes |
Teachers/assistants carry around chocolate trays to show students Students ask questions and try to formulate strategy to estimate mean Teachers/assistants prompt students, give hints if necessary |
|
|
20 minutes |
Teacher directs students to load Chocs and Blocks web page |
Chocs and Blocks web address and QR code Chocs and Blocks web page Spreadsheet of choice sample results |
|
20-30 minutes |
Students choose blocks and submit choice samples |
|
|
30-40 minutes |
Teacher analyses choice sample means and leads discussion of strategies, interrogation of assumptions Reveal true mean; reward best estimate(s) with chocolate |
Statistical software eg. Minitab Spreadsheet of choice sample results |
|
40 minutes |
Teacher shows students how to switch to ‘random sample’ mode |
Chocs and Blocks web page |
|
40-42 minutes |
Students generate and submit random samples |
Spreadsheet of random sample results |
|
42-50 minutes |
Teacher analyses random sample means, compares with choice samples, discussion |
Statistical software eg. Minitab |
|
50 minutes |
Distribute chocolate to everyone as they leave |
Acknowledgements
Chocs and Blocks is based on an earlier activity by Professor Nye John and Dr David Whittaker from the University of Waikato at the end of the last century.
The Chocs and Blocks webpage was designed by Sharon Gunn and Anthony Morphett and developed by Learning Environments and Anthony Morphett, with financial support from the School of Mathematics and Statistics. An earlier Chocs and Blocks website was developed by Russell Jenkins. The Chocs and Blocks setup program was developed by Anthony Morphett. This documentation was written by Sharon Gunn and Anthony Morphett.
Further references
Sharon Gunn. (2011). Towards an Understanding of Statistical Task Design. Proceedings of Volcanic Delta 2011: The Eighth Southern Hemisphere Conference on Teaching and Learning Undergraduate Mathematics and Statistics, Rotorua, New Zealand, 27 November - 2 December 2011, p.120 - 128
Sharon Gunn and Anthony Morphett. (2017). An interactive statistical sampling activity with chocolate. 2017 Mathematical Association of Victoria Annual Conference proceedings, p.25 - 30